Triangle Pattern in Trading – Types of Triangles and Strategies Explained

What is Triangle Pattern in Trading?

The Triangle Pattern, is a type of trend-consolidation chart pattern in technical analysis. It is formed by drawing two trendlines that gradually converge between the highs and lows of the price chart, thus forming a triangular pattern.

The convergence of prices in this pattern indicates that market volatilities are gradually diminishing, entering a period of sideways consolidation, and signalling that significant volatility may be imminent. Therefore, triangle patterns are widely observed by traders in various trading markets, including stocks, forex, indices, or commodities.

Triangle pattern in trading can be easily drawn on a candlestick chart or a line chart, and based on the formation of the pattern, types of triangle chart pattern can be categorised into:

  • Symmetrical Triangle
  • Ascending Triangle
  • Descending Triangle

Despite all three being types of triangle patterns, they each have different market implications. Therefore, in the following sections, we will provide a detailed explanation on the formation and application of these three patterns.

Symmetrical Triangle Pattern

Symmetrical triangle pattern or also known as converging triangle pattern, is formed by the convergence of the upper and lower trendlines towards the right, creating a triangular pattern where the upper and lower converging trendlines are symmetrical or close to symmetrical.

This type of triangle pattern indicates that market participants have a certain degree of uncertainty about the price trend and are waiting for a breakout to confirm the direction of the trend.

Symmetrical Triangle

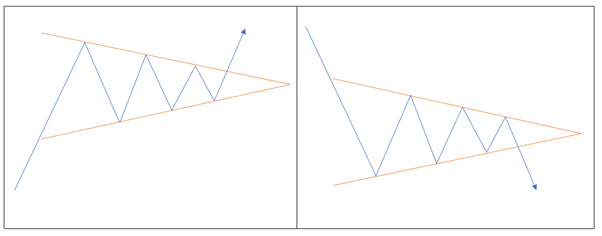
Despite the uncertainty, symmetrical triangles are generally considered a continuation pattern. After a breakout from the triangle, traders will confirm the direction of the new trend phase based on the breakout direction.

  • Bullish symmetrical triangle – If it occurs within an uptrend, a breakout above the upper trendline suggests that prices are likely to continue to rise.
  • Bearish symmetrical triangle – If it occurs within a downtrend, a breakout below the lower trendline suggests that prices are likely to continue to decline.

Ascending Triangle Pattern

Ascending triangle pattern is formed by a horizontal resistance line on the top and an upward sloping support trendline at the bottom. The appearance of an ascending triangle typically indicates a bullish momentum in the market, as market participants are gradually accumulating a buying momentum. 

Hence, ascending triangle is considered a bullish pattern.

Ascending Triangle

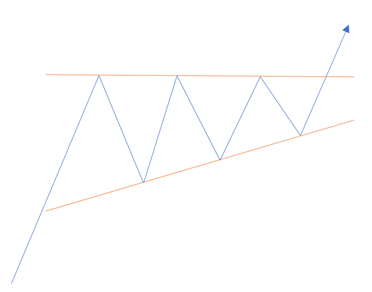
From the perspective of market dynamic in bulls and bears, the bullish ascending triangle can be interpreted as follows:

  • Bullish momentum exists in the market, driving prices higher.
  • However, prices are hindered from reaching higher levels by selling pressure.
  • Despite the selling pressure, bullish momentum continues to push the lows higher.
  • Eventually, bears exhausted, and bulls reasserts control over the market.

if an ascending triangle appears in an uptrend, it suggests that the uptrend is likely to continue. Conversely, if it appears within a downtrend, it indicates that bullish momentum is building up, and a trend reversal may occur.

Descending Triangle Pattern

As opposed to the ascending triangle pattern, descending triangle pattern works the other way round.

Descending triangle pattern is formed by a horizontal support line at the bottom and a downward sloping resistance trendline at the top. Its appearance typically indicates a sustained downward momentum in the market, as market participants are gradually accumulating a selling pressure, hence it is considered a bearish pattern in most scenario.

Descending Triangle

From the perspective of the tug-of-war between bulls and bears, the descending triangle can be interpreted as follows:

  • Selling pressure exists in the market, continuing to suppressing the price.
  • However, prices are supported from reaching new lows by bulls.
  • Despite the bullish support, selling pressure persists and stronger.
  • Eventually, bullish momentum exhausts, and bearish momentum reasserts control over the market.

If a descending triangle appears within a downtrend, it suggests that the downtrend is likely to continue. Conversely, if it appears within an uptrend, it indicates that bearish momentum is building up, and a trend reversal may occur.

Is Triangle Pattern a Reversal or Continuation Pattern?

Traders who are new to triangle chart patterns tend to think that all types of triangle patterns are the same. However, as mentioned above, despite being part of the triangle chart pattern, they can signify different interpretations of market development.

So, are they reversal or continuation patterns? The answer, they can be both. Once again, we will provide a quick summary of these different triangle patterns:

Symmetrical TrianglePotential for a breakout in either direction; however, high probability of forming a continuation pattern.
Ascending TriangleHigh probability of bullish opportunities; If it appears within an uptrend, higher probability of upside breakout.
Descending TriangleHigh probability of bearish opportunities; if it appears within a downtrend, higher probability of downside breakout.

Triangle Pattern Trading Strategies

Being one of the most commonly found chart pattern in trading, the triangle trading strategy can be applied to all kind of traded asset, including the stocks, forex, crypto and commodities market. Hence, by mastering the triangle pattern strategy, traders can trade across all kind of market.

The formation of triangle convergence patterns is based on theories of trendlines, support lines, and resistance lines, and therefore, the application of triangle patterns is also based on the same concepts as support & resistance (S&R).

1. Triangle Pattern - Support & Resistance Trading Strategies:

  • After identifying the upper resistance line of the triangle, opportunities to short (sell) can be sought when the price touches the resistance line.
  • After identifying the lower support line of the triangle, opportunities to long (buy) can be sought when the price touches the support line.

2. Triangle Pattern - Breakout Trading Strategies:

  • After the price breaks out of the converging support or resistance line of the triangle, opportunities for entry can be sought.
  • After the price breaks out of the converging support or resistance line of the triangle, opportunities for entry can be sought when the price retraces to test the support or resistance line.
In the next section, we will further explain with real-life example how we can apply those triangle strategies into trading.

Triangle Pattern Strategy Explained

After understanding the basic concept of applying triangle patterns, we will now provide a more comprehensive tutorial on the application of triangle pattern through various real-life examples.

1. Symmetrical Triangle Pattern Trading – Breakout & Retest

Triangle Breakout Strategy

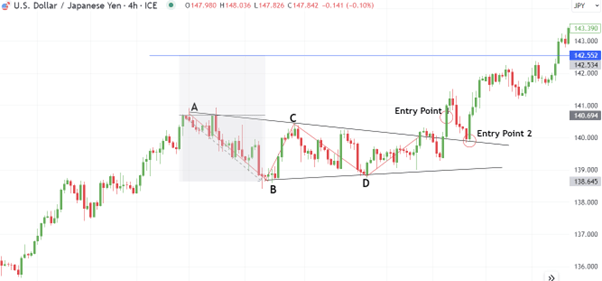
The chart above shows the 4-hour trend of USD/JPY. After developed an uptrend, it began to enter a consolidate period. By marking the two swing highs and swing lows with A, B, C, and D, we can identify a symmetrical triangle is formed in USD/JPY chart.

In this symmetrical triangle, we can find two buying opportunities:

  • Entry Point 1 is when the price breaks above the upper resistance line of the triangle. After confirming the breakout, we can enter the trade.
  • Entry Point 2 occurs when the price retraces after breaking out of the converging triangle. When the price retraces to test the support line formed by the previous resistance line, it provides another opportunity for investors to enter the trade, which is even better than the first entry point.

2. Descending Triangle Pattern Trading – Breakout and S&R Range

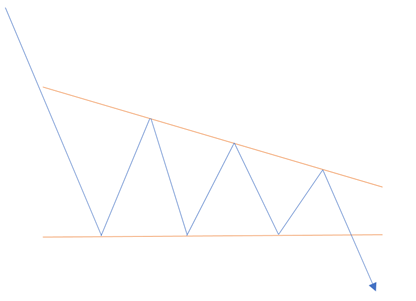
Using the GBP/USD chart as below, we can see that despite being in a downtrend, the Pound against the U.S. Dollar has repeatedly received bullish support without making new lows. However, each price rebound has failed to reach higher highs.

By marking the two highs and lows as indicated by points A, B, C, and D, we can identify the formation of a descending triangle.

Descending triangle strategies

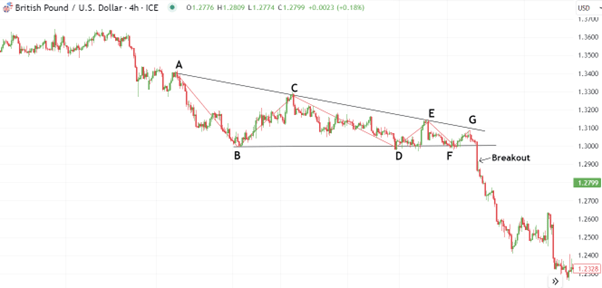
Given that this descending triangle appears in a downtrend, theoretically, we may be more inclined to seek for short-selling opportunities. Within this descending triangle, we can also find multiple trading opportunities.

  • Range Trading – With favoring to the short-selling bias, when the price rebounded to the resistance line at point E, we can choose to short at the resistance level, with the first profit target near the support at point F.
  • Breakout Trading – After the consolidation gradually narrows, the price is likely to anticipate a breakout. Upon the confirmation of price effectively breaking below the support line, we can enter the short position.
  • Additionally, point G also provides an excellent entry opportunity. Ass the range of convergence trend gradually shrinks, the likelihood of a breakout increases. For experienced traders, point G can be seen as a good entry point, where they can hold the trade until a breakout happen.

3. Ascending Triangle Pattern Trading – Trend Reversal

Lastly, let’s go through one more practical example, with the following chart being the 4-hour chart of the Nasdaq 100 mini futures.

Ascending Triangle Trading

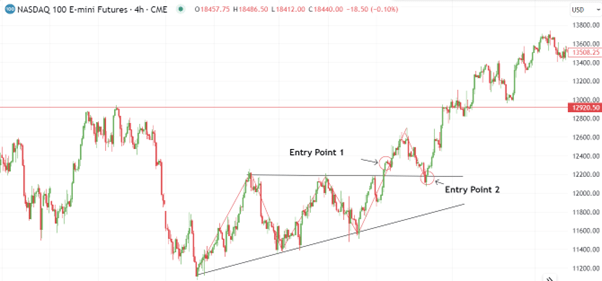
After developing into a downtrend for some time, the Nasdaq 100 futures began to forms triangle pattern known as an ascending triangle. Therefore, we can pay attention to the possibility of a trend reversal, although in the given circumstances, we cannot rule out the possibility of the price continuing to decline.

In the case of the Nasdaq 100 futures, the ascending triangle pattern broke above, providing traders with two entry opportunities:

  • Entry Point 1 – After the price breaks above the resistance level, traders may opt to enter a long position.
  • Entry Point 2 – Similar to a neckline entry in a head and shoulders pattern, traders can also enter long positions when the price retests the neckline level.
Table Content
Relevant Articles